
True Strength
The standings lie.
True Strength doesn't.
Every team rated against everyone it played, with who actually suited up. Then priced against the sportsbook. Only the real edges get posted.
See it in action
Real screens from slamwager.com: the Brewers–Padres playoff game.

Every game, one tapTonight's matchup and live score in one place, plus Ask Slam with Picks + Slam. 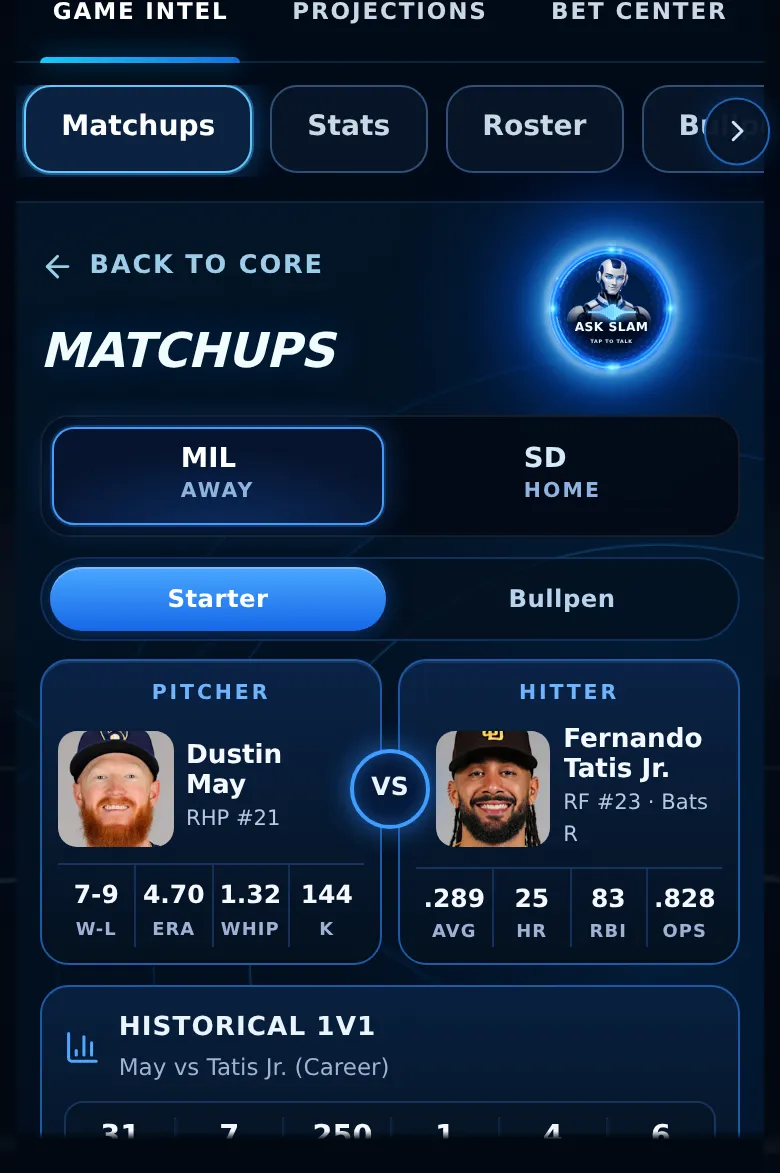
Pitcher vs. hitterWho's starting, how they match up, every at-bat they've had. 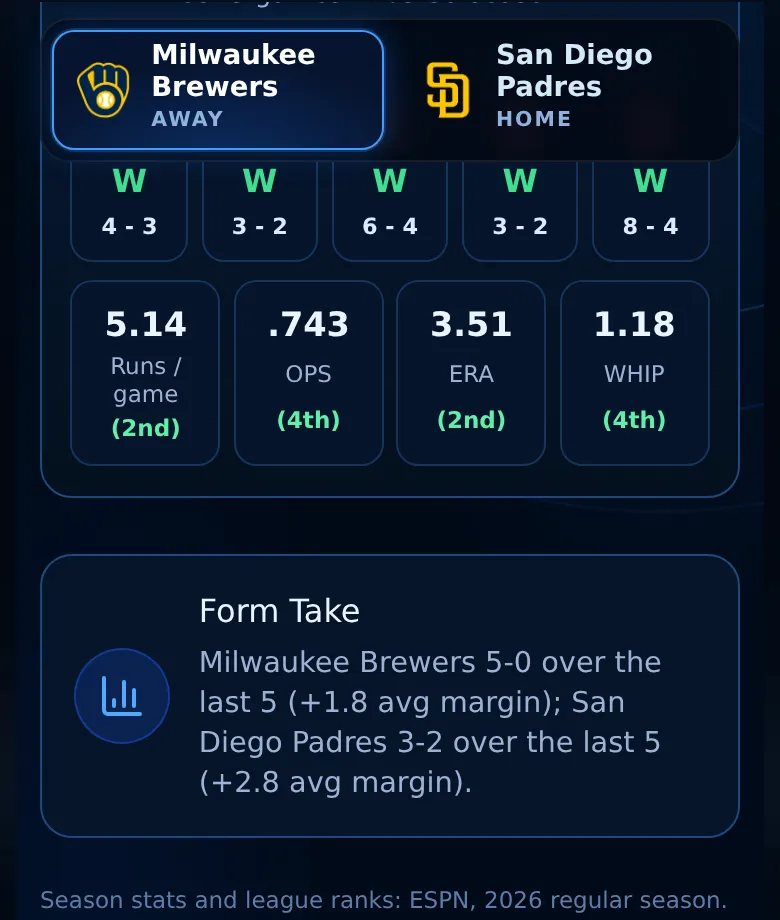
Form that means somethingLast five, and where each team ranks in the league. 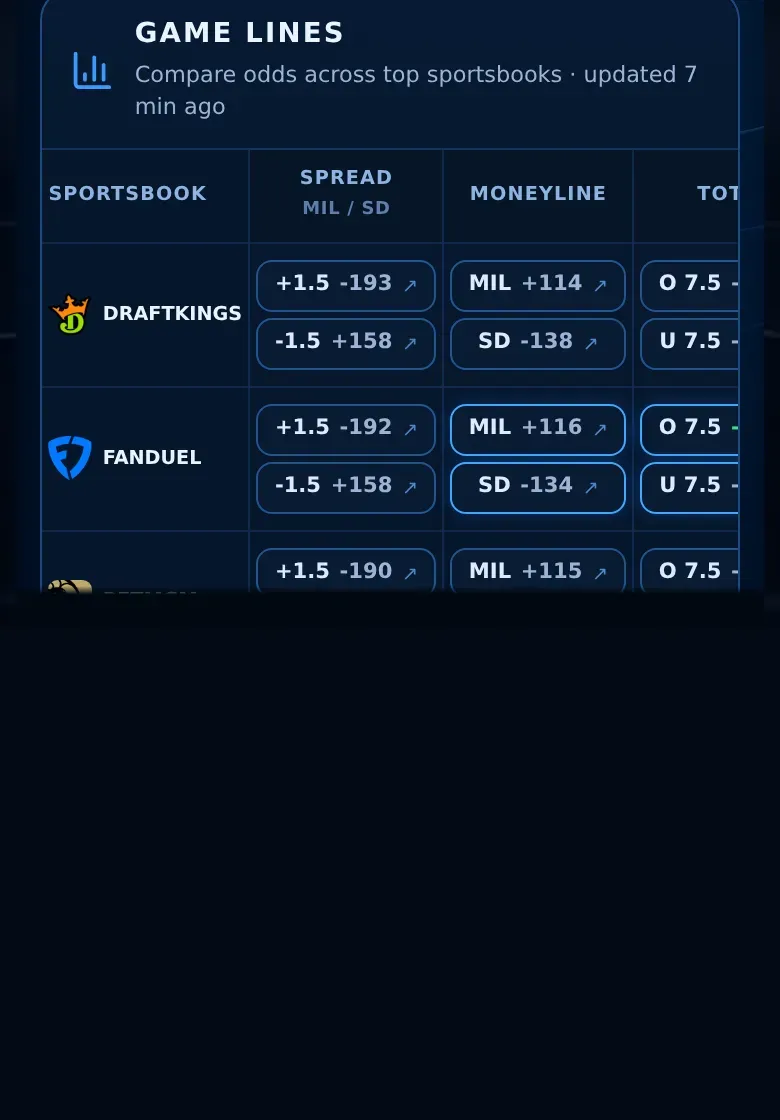
Every book's priceSpreads, moneylines and totals across the sportsbooks, side by side. 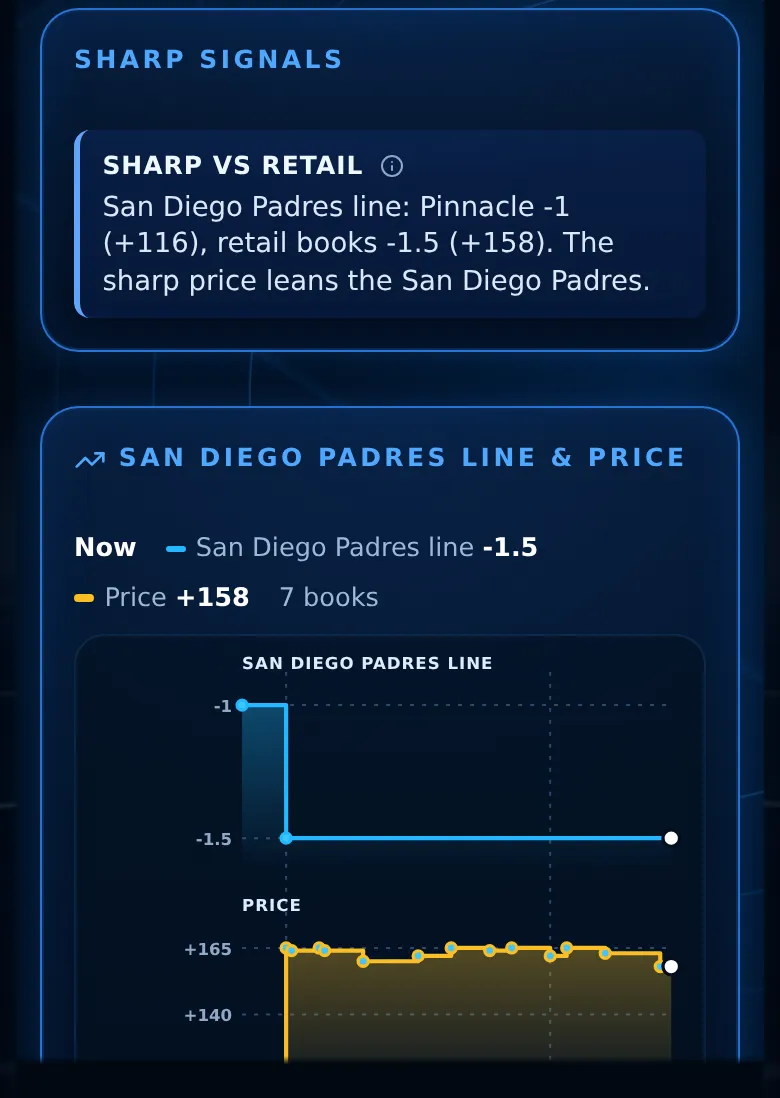
Where the line movedLine and price history, plus what the sharp books are saying. 
One real pick, freeEvery day, straight from the True Strength engine.
Same record. Not the same team.
Beat three losing teams by a field goal each. Blown out by the only good team it played.
Lost by three on the road to the best team in the league. Handled everyone else.
The standings call them equal. Anyone who watched knows better. True Strength reads the games, not the record.
An example, not two real teams.
What it sees that a record can't
- Who you played
Every score is solved against every opponent at once. Putting 30 on a top defense counts for more than 30 on the worst one.
- Who actually played
A loss without the starting QB doesn't sink a team's rating. This season the NFL solve prices a missing starter at close to three points.
- Tonight, not an average night
Injuries, confirmed lineups, starting pitchers, rest and the forecast. In 15+ mph wind, NFL totals have landed about four points low.
- Tested before it's trusted
Every adjustment is replayed on past seasons first. Ideas that don't make the predictions better stay out, however good they sound.
From a rating to a pick
- Project the score
Both teams' True Strength, adjusted for tonight.
- Turn it into odds
How often games really land near a projection, measured, not assumed.
- Beat the book or pass
A pick posts only when our price beats the sportsbook's. If not, it's a pass, and we say so.
Locked at kickoff. Graded in public.
Every pick is graded at the price it was posted, wins and losses, on the record for everyone to see. No deleted losers, no rebuilt numbers after the fact.
See tonight's edge for yourself.
One free pick a day, the full card with a membership.
Read the full method
A record is a summary. True Strength reads the games.
Two teams are 3–1. One beat three losing teams by a field goal each and was blown out by the only good team it played. The other lost a one-score game on the road to the best team in the league and handled everyone else. Standings call them equal. Anyone who watched knows they are not.
True Strength exists to answer one question honestly: if these two teams played tonight, on this field, with these players available, what should the score look like? Everything below is how it gets there, and why each piece is in it.
Every team, measured against everyone it played
True Strength doesn't grade a team on its own results in isolation. It solves the whole league at once. Each team gets an offense rating (points it scores against an average defense) and a defense rating (points it allows against an average offense), plus a league-wide home edge. Every final score is one equation: league average, plus one team's offense, plus the other team's defense, plus home field when it applies.
Hundreds of those equations are solved together until every rating agrees with every result. That is what makes it schedule-adjusted all the way down: putting 30 on a top-five defense counts for more than putting 30 on the worst one, and the quality of an opponent's opponents is already inside the number. The result is a rating in real units (points, goals or runs per game against an average team on a neutral field), not an abstract score.
Last season counts exactly as much as it has earned
Week one ratings built from one game are noise, and ratings frozen from last year miss everything that changed. True Strength starts each team from last season's rating, but only as much of it as history says carries over. It measures that by checking how well one season's ratings predicted the next, league by league. That prior is worth a fixed number of games and fades as real results arrive.
College football is the sharpest example. Rosters turn over, and early-season ratings are mostly educated guesses, so recent games count more there: each game's weight halves every seven days, and last season's carry-over is trimmed further. Replaying every FBS and FCS game from 2023–25, with each week predicted only from the games before it, that cut the average miss on the final margin from 17.9 points to 17.1. It held up on this season's games too, which weren't used to choose it.
It knows who actually played
A team that lost by 15 without its quarterback didn't show you its real strength. Neither did the opponent that beat it. True Strength reads the box score lineup of every game this season, works out each team's real regulars, and records who sat. The whole league is solved with those absences in it, so a team isn't marked down for a game its stars missed, and its opponent isn't credited for beating a shorthanded roster.
The same solve learns, from every team's games at once, what an absence is worth. That means a missing starting quarterback, a missing goaltender, a share of the regular rotation sitting, or the second night of a back-to-back. This season, the NFL solve prices a missing starting quarterback at close to three points. Before each game, tonight's injury report and confirmed lineups are applied the same way.
Then it prices tonight, not an average night
Ratings describe a team on a neutral night. Tonight is never neutral. Outdoors, the forecast is applied: across every NFL game from 2015 to 2025, totals landed about four points under expectations in 15+ mph wind and over three points under at kickoff temperatures of 32°F or below, so the projected total moves accordingly. Football projections also weigh the line-of-scrimmage matchup. Baseball builds runs from the actual starting pitchers and bullpens, not team averages.
A handful of situational corrections sit on top, each one there because replaying past seasons showed the base ratings missed it. Examples: hockey's second night of a back-to-back, home ice in the first month of the NHL season, and the lower scoring of playoff baseball. Neutral sites, from London games to bowl games, get no home edge at all.
Nothing goes in on a hunch
Every adjustment is tested the same way before it touches a projection. The past is replayed one week at a time, ratings are re-solved using only what was known before each game, and the question is simple: did the predictions get closer to what actually happened?
Plenty of ideas fail that test, and they stay out. Weighting missing players by their minutes looked smarter than counting absent regulars, but across a full NBA season, two WNBA seasons and an NHL season it was no more accurate. Extra rest days, three games in four nights and long road trips added nothing beyond back-to-backs. A model that can say no to a good-sounding idea is one whose numbers mean something.
From a score to a price
A projected score isn't a bet. Real games scatter around any projection, and True Strength measures that scatter honestly. It re-solves the league at points through the season and records how far the next week's results actually landed from what it would have projected. That spread, not an assumed one, turns a projected margin and total into a probability for every side, every spread and every total, and powers the Monte Carlo view on each game.
Those probabilities are compared with every sportsbook's current price. A side becomes a pick only when it clears a minimum expected value: 2% at the least, and higher in markets where the engine is held to a stricter bar. Even then it is reined in: win chances are pulled toward a coin flip where past results showed the model ran hot, moneylines chalkier than −200 or longer than +500 are off the table, and the stars (one to three units) scale with the edge. When nothing clears the bar, the answer is a pass, and a pass is shown as one.
Locked at kickoff, graded in public
Once a game starts, the projection that stood at kickoff is the one that's kept, so a pick is never judged by a number rebuilt after the fact. Every pick is graded at the price it was posted, and the record stays on the board: by sport, by market, and split into favorites and underdogs, overs and unders.
No model removes the uncertainty from sports, and True Strength doesn't claim to. What it offers is a number built the way the games were actually played, adjusted only where the evidence says it should be, and accountable every night it's used.
Frequently asked questions
Is True Strength just the betting odds?
No. During the season the ratings come only from games played: scores, every opponent faced and who was available. Before a season starts, the preseason Slam Rankings blend last season's True Strength rating with what championship prices imply about offseason moves, and the market drops out once real games are played. Sportsbook prices are used separately, to decide whether a projection is worth a bet.
Does True Strength guarantee winning picks?
No. It's a disciplined estimate with its uncertainty measured, not a promise. Picks win and lose, and the full graded record is shown, losses included.
Why does True Strength sometimes pass on a game?
A pick needs a projected expected value of at least 2% (more in some markets) at a real sportsbook price and has to clear the price guardrails. A strong projection can still be a pass when the market already agrees with it.
How often are the ratings updated?
The league solves re-run through the day as results and lineups come in, and tonight's injuries, lineups and forecast are applied to each game before it starts.